To help you maximize the value of your plan, Builder provides key metrics that track usage, engagement, and productivity.
This document covers metrics for a Space as featured on the Builder Home screen.
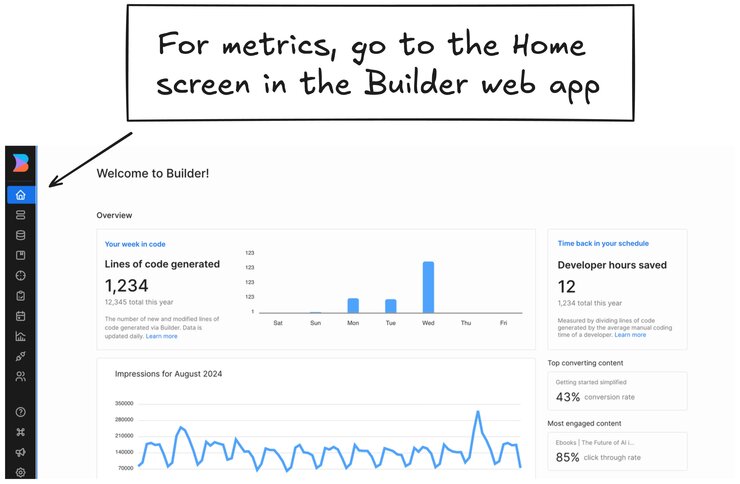
The image below shows the Builder web app Home screen, which features important metrics. Your numbers might differ from the placeholder data in the image.
These metrics are available to all customers, regardless of plan. Displaying these metrics does not impact subscription costs.
This metric measures the total number of lines of code generated through Builder, covering code generations from Visual Copilot and content published through the CMS. It includes lines of code that developers explicitly export from the Generated Code panel and those automatically generated by publishing content through the CMS.
Builder tracks lines of code from all outputs within Builder, including the Generated Code panel and CMS:
- Visual Copilot code generations: Every line of code that developers generate and export from the Generated Code panel counts. For example, if a component displays 28 lines in the Generated Code panel, all 28 lines contribute to the total count, regardless of code quality. For more information, read Generate Code.
- CMS publishing: Builder estimates lines of code for CMS publishes based on the internal code generation required to render the published content. These estimations represent the amount of code needed to produce the final output, even though these lines are not directly generated by developers.
This method provides an accurate reflection of the value Builder generates by capturing all content and code produced across the platform.
Lines generated from the Builder Figma Plugin mapping functions or AI-generated content do not count toward this metric.
To find the current count of the lines of code generated:
- While logged into Builder, go to the Home screen.
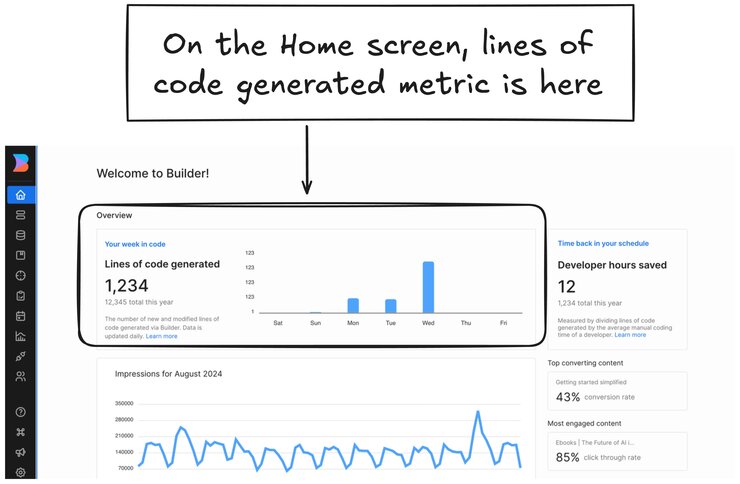
- Lines of Code Generated for the week is displayed at the upper left along with a graph of the metrics by day.
The image below shows the Builder Home screen with an arrow to the Lines of Code Generated tile.
For more information on this feature, read Generate code.
Developer hours saved estimates the amount of development time saved through automated code generation compared to manual coding.
This metric serves as a proxy for improvements in developer productivity by demonstrating the efficiency gains and value added by using Builder.
To calculate developer hours saved, Builder uses a predefined ratio of 20 lines of production-ready code per hour, based on industry research and best practices.
Studies have shown that developers typically produce between 10 to 50 lines of code per hour, depending on the complexity of the task, with 20 lines being a conservative midpoint that reflects real-world scenarios.
To display your estimated number of developer hours saved:
- While logged into Builder, go to the Home screen.
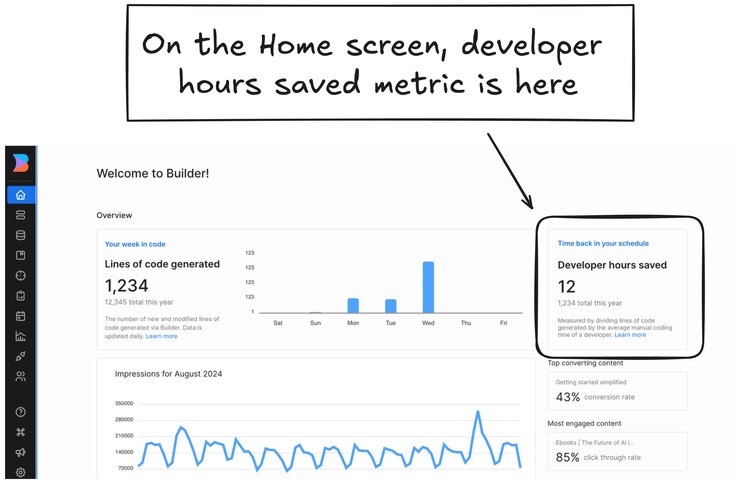
- Find the Developer hours saved estimate at the upper right.
The image below shows the Builder Home screen with an arrow to the Developer hours saved tile.
Impressions, which track how often your content is viewed, are one of the key metrics available in Builder.
For a deeper dive into how Impressions work, read Understanding Impressions.
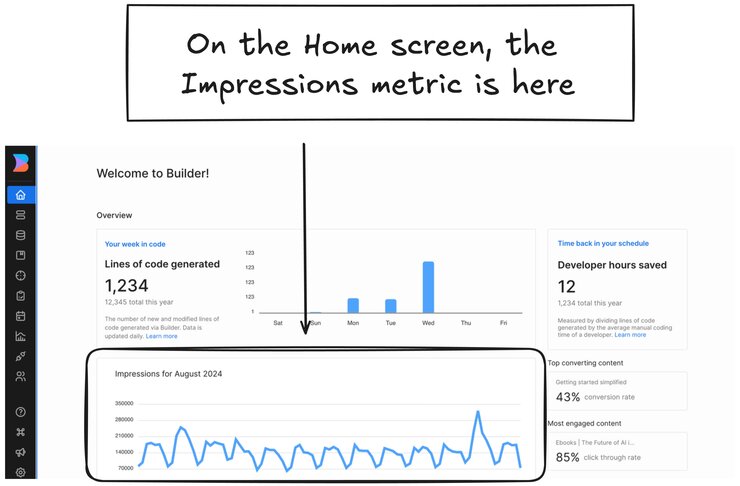
The image below shows the Impressions graph on the Builder app Home screen.
Code Generations refers to each instance where code is generated or modified within Builder, including initial conversions of Figma designs and any subsequent edits.
Use this metric to understand your quota usage and track engagement with Visual Copilot. It provides insight into how frequently your team is using the code generation features.
Each time code is generated or modified through the Builder interface, it counts as one code generation.
To find your current code generations count:
- With a content entry open — that is, you're in the Visual Editor — click on the Get Code icon,
< >, which is in the upper right of the Visual Editor near the Publish button. - In the Generated Code panel, your number of code generations is displayed in the upper left. For example,
422/10,000, which would mean that you had generated code422times out of an available10,000.
The video below shows clicking on the Get Code icon and then points out the upper left location of the count in the Generated Code panel:
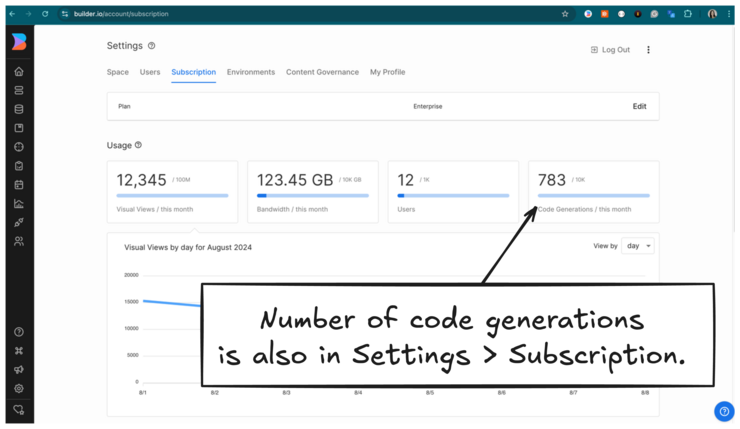
You can also find this count in Settings in the Subscription tab.
- Go to Settings.
- Click the Subscription tab.
- Find your number of code generations for the month in the Code Generations tile.
The screenshot below shows the Subscription tab in Settings with an arrow to the Code Generations tile.
This document covered metrics for a Space as featured on the Builder Home screen, though other types of data are also available:
- Understanding Usage: Monitor your resource consumption with detailed usage analytics in Builder, helping you optimize Visual Views and bandwidth usage per URL to maximize your subscription’s value
- Understanding Impressions: Explore how Builder tracks Impressions to provide detailed analytics on content performance, helping you understand how often your content is viewed.
- Understanding Visual Views (Pageviews): Learn how Visual Views, also known as Pageviews, are tracked in Builder, including what counts toward your Visual Views, what doesn’t, and how Builder ensures accurate tracking with minimal double counting.
- Impressions Compared to Visual Views: Discover the key distinctions between Impressions and Visual Views in Builder, exploring how each is tracked and their unique roles in content analytics.
- Content Entry Insights: Learn about the data available for individual Pages and Sections.


