Made in Builder.io

Upcoming webinar with Figma: Design to Code in 80% Less Time

Announcing Visual Copilot - Figma to production in half the time

Builder.io logo
Talk to Us
Platform
Developers
Talk to Us

Blog

Home

Resources

Blog

Forum

Github

Login

Signup

×

Visual CMS

Drag-and-drop visual editor and headless CMS for any tech stack

Theme Studio for Shopify

Build and optimize your Shopify-hosted storefront, no coding required

Resources

Blog

Get StartedLogin

‹ Back to blog

Web Development

How to Inspect Interactions in the Browser

February 14, 2023

Written By Sami Jaber

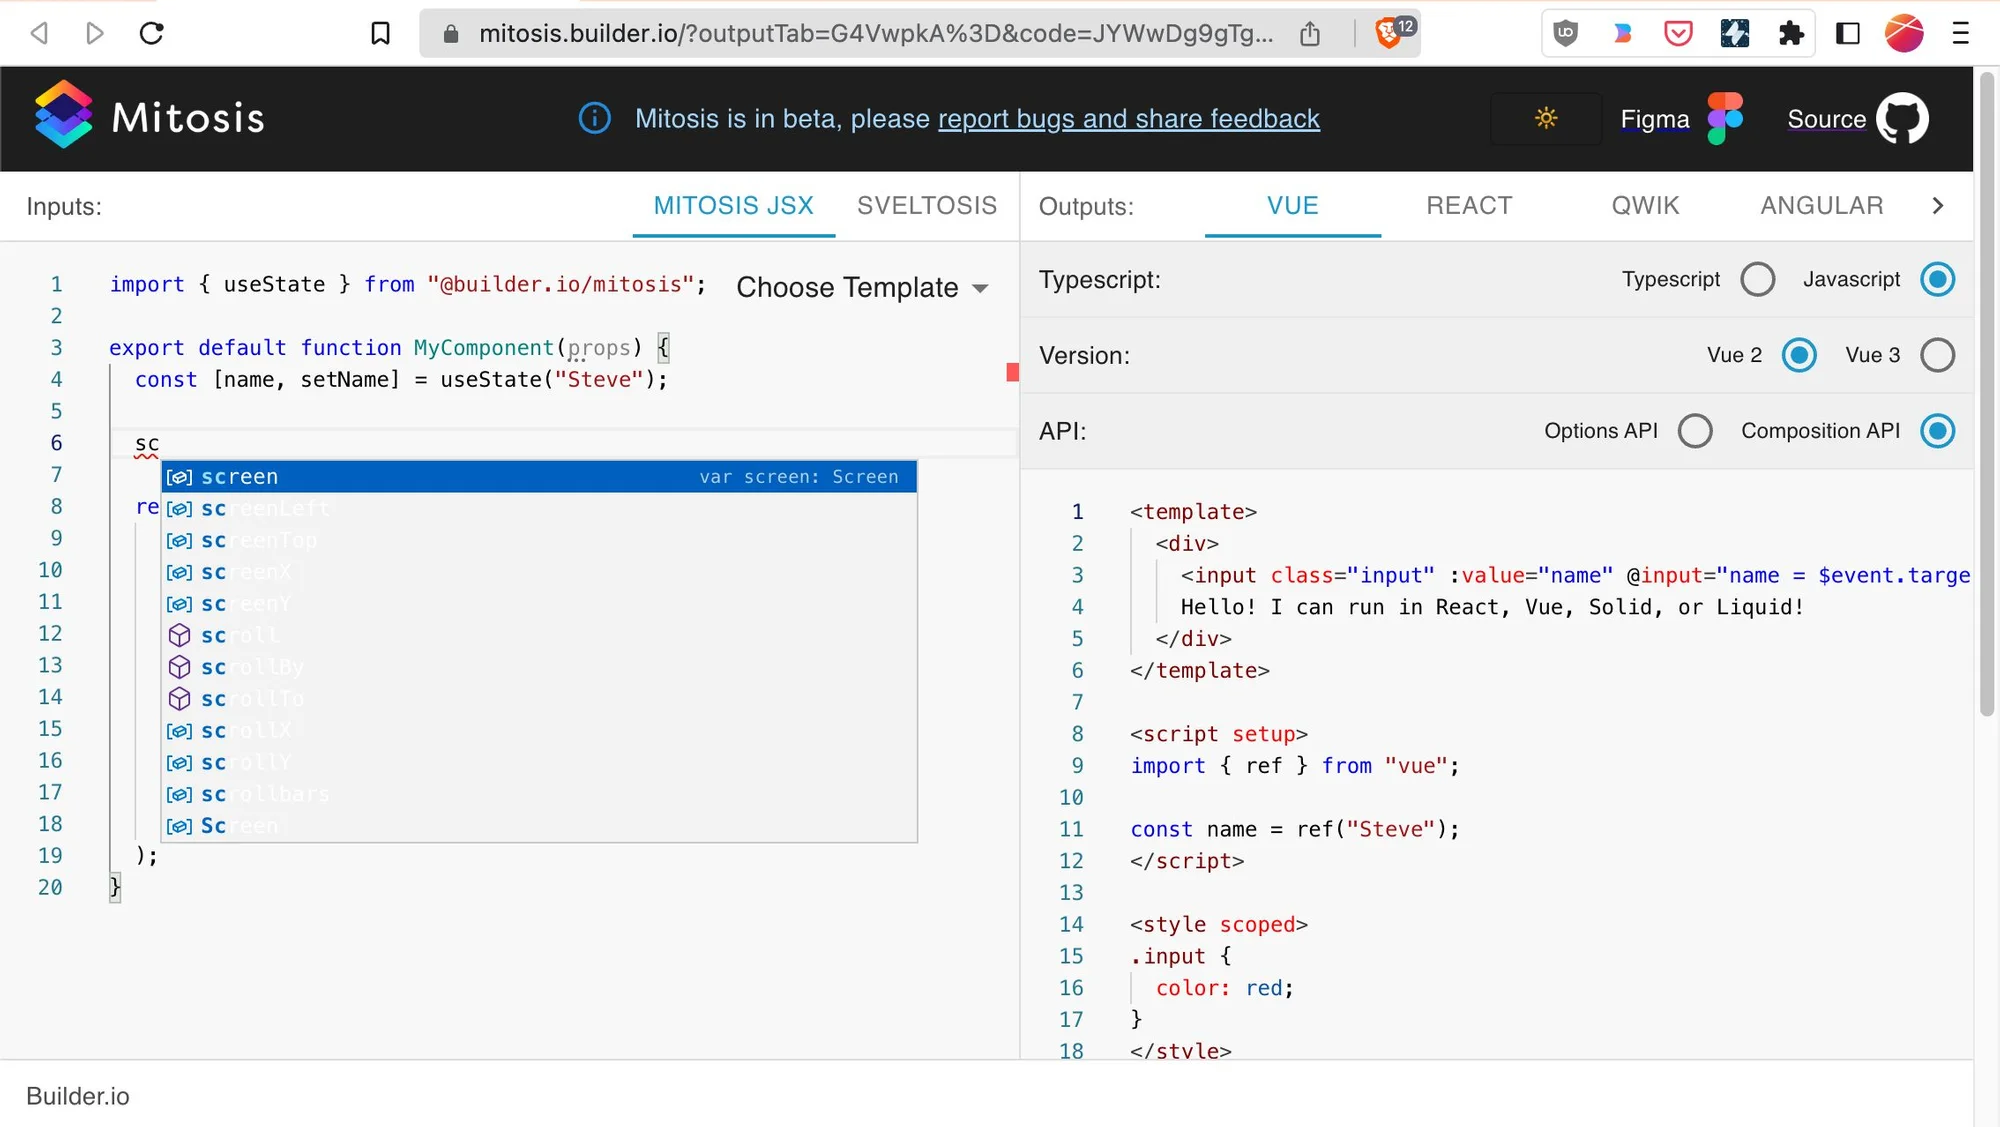
The other day, I tried to debug this autocomplete list’s broken styles:

A screenshot of autocomplete broken styles.

But as many of you have experienced, when you click in your console, that moves focus out of your webpage, and the popover goes away! In this case, I can’t even right-click the popover to click Inspect Element:

I looked around and found two wonderful solutions to this problem in Chromium browsers.

Solution #1: Emulate Focus Page

Open your console, press Cmd+Shift+p to open the command palette, and search for Show Rendering :

A screenshot of a search in the command palette in chrome devtools for "show rendering".

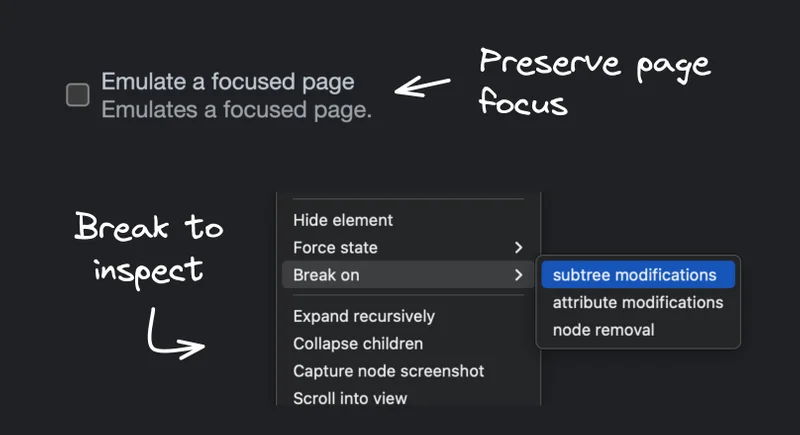
This opens a Rendering tab, where you can enable Emulate a focused page.

a screenshot of the Rendering pane inside devtools showing "emulate a focused page" checkbox selected.

This will preserve focus when you click around in your console.

This one is less practical for this particular example, but can be really useful in situations that have nothing to do with focus. You can COMPLETELY pause JS and enter debugging mode whenever a portion of the HTML has any modifications happen to it!

You start by adding a breakpoint to the subset you care about. In this case, I’ll choose the entire code editor area:

A screenshot of devtools element pane with the sub menu showing and highlighting "break on".

And now, this is what happens when I type a character in the editor:

As you can tell, this requires stepping a lot in the debugger. I prefer solution #1 to preserve focus, but I can see myself using the Break On feature for other complex interactions, especially if I want to jump into the JS code!

Hopefully, you’ll be able to use these tools the next time you want to debug your client-side UIs. If you know of any other cool browser dev tools, share them with us!

Introducing Visual Copilot: convert Figma designs to code using your existing components in a single click.

Try Visual Copilot

Share

Twitter
LinkedIn
Facebook
Hand written text that says "A drag and drop headless CMS?"

Introducing Visual Copilot:

A new AI model to turn Figma designs to high quality code using your components.

Try Visual Copilot
Newsletter

Like our content?

Join Our Newsletter

Continue Reading
Company News3 MIN
Builder.io closes $20 million in funding led by M12, Microsoft’s Venture Fund
WRITTEN BYSteve Sewell
April 24, 2024
AI9 MIN
How to Build AI Products That Don’t Flop
WRITTEN BYSteve Sewell
April 18, 2024
Web Development13 MIN
Convert Figma to Code with AI
WRITTEN BYVishwas Gopinath
April 18, 2024